
How to measure product-market fit.
Survey your users, check whether retention flattens, and segment the results. If 40% of one segment would be very disappointed without you, you have a real signal.
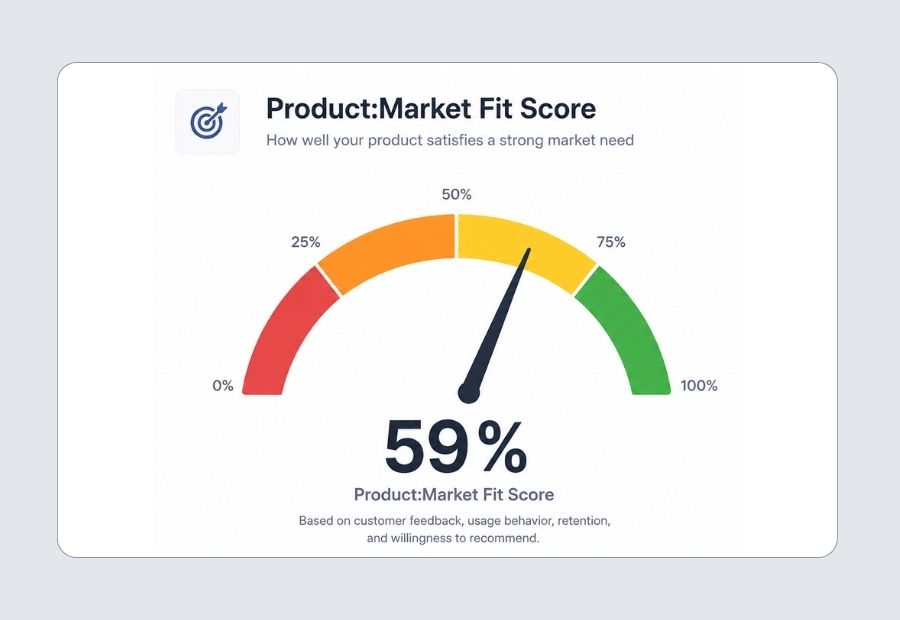
Will people pay for my idea?The short answer: measure product-market fit with four signals together: the Sean Ellis survey (40% or more of users say they would be “very disappointed” without your product), a retention curve that flattens instead of falling to zero, NPS broken out by customer segment, and steady weekly active usage. No single metric is enough on its own.
Most founders say they’re ‘close’ to product-market fit. Close is not a measurement. It’s a feeling, and feelings don’t tell you what to fix.
Segment before you decide. An average across all users hides the group that loves you. Superhuman scored 22% “very disappointed” overall, reached 33% by focusing on its most enthusiastic users, and hit 58% within three quarters (First Round Review, 2018).
Getting these signals right changes the decisions you make next. You stop pouring budget into acquisition before retention is solved. You stop building features nobody asked for. You start knowing which customer segment to double down on.
Last updated: September 29, 2026
By the numbers
What should you measure to find product-market fit?
What is the Sean Ellis 40% test?
Ask your users: how disappointed would you be if this product disappeared? If 40% or more say ‘very disappointed,’ you have a meaningful PMF signal. Below 40%, the product is not yet essential to enough people.
What does a flattening retention curve mean?
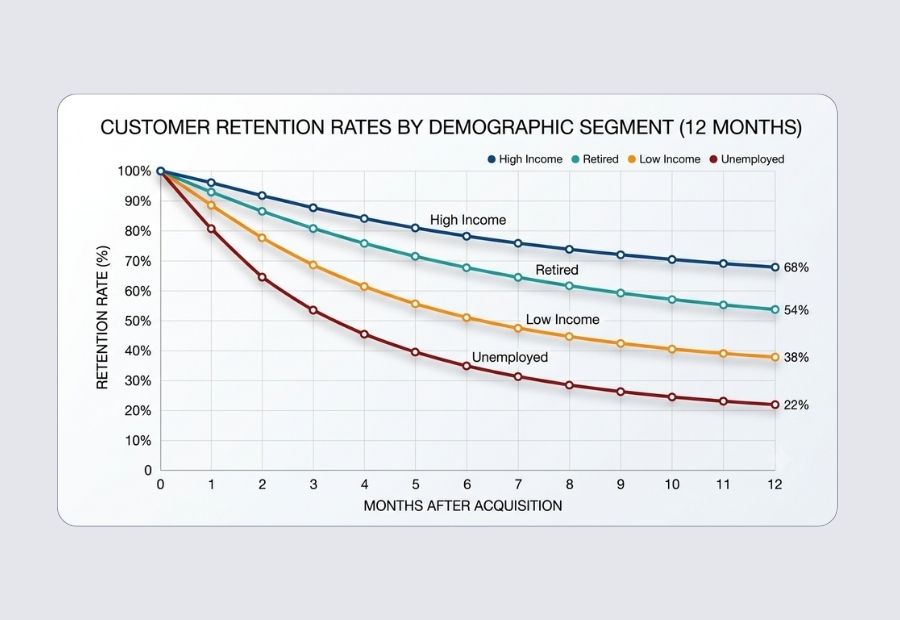
Plot retention over time. A curve that keeps falling to zero means you have a leaky bucket, not a product. A curve that flattens — even at 20% — means a core segment finds real value.
Should you use NPS or a PMF survey?
NPS measures satisfaction. PMF surveys measure dependency. They answer different questions. Use NPS to track customer experience. Use PMF surveys to find out whether the product is irreplaceable.
Why segment before you score?
Your PMF score looks weak when you average across all users. Segment by use case, company size, or acquisition channel. A strong signal inside one segment is the direction the whole product should move.
When should you pivot or persevere?
A PMF score below 40% is not a verdict. It is a map. If a specific segment scores above 40%, the pivot is repositioning — not rebuilding. If no segment clears the bar, the core value proposition needs rethinking.
How do the four signals fit together?
Run the PMF survey, plot your retention curve, calculate NPS by segment, and track weekly active usage. These four data points together tell you more than any single metric. One metric alone will mislead you.
How do you run a product-market fit measurement sprint?
Work through the four checks in order. Each one narrows where to look next.


That is the share of surveyed users who must answer ‘very disappointed’ before PMF is considered real — and most early-stage products miss it on the first measurement.
What changes when you measure PMF correctly?
Your retention curve flattens instead of falling to zero.
One customer segment is clearly identified and your whole roadmap reflects it.
Budget goes to acquisition only after the retention problem is solved.
The pivot-or-persevere decision gets made on data, not founder fatigue.
Your PMF survey score climbs as the product narrows to what that segment actually needs.
Investors and partners see a product with a measurable signal, not a founder with a hunch.
Product-market fit: common questions
The answers founders ask before they commit time to building this.
What is the Sean Ellis test and why does 40% matter?
Sean Ellis developed a one-question survey: ‘How would you feel if you could no longer use this product?’ If 40% or more of respondents answer ‘very disappointed,’ the product has reached a meaningful level of dependency. Ellis set the benchmark after comparing nearly 100 startups. Below 40%, the product is not yet essential to enough people to sustain organic growth.
How is a PMF survey different from NPS?
NPS measures satisfaction — whether a customer would recommend you. A PMF survey measures dependency — whether the product would be missed. A product can score well on NPS and still have weak PMF. They answer different questions and should not be substituted for each other.
What does a healthy retention curve look like?
A healthy retention curve flattens. Early churn is normal. The signal is whether the curve levels off at some point — even at 20% — rather than continuing to decline toward zero. A curve that flattens means a segment of users keeps coming back. That segment is your PMF signal.
What should I do if my PMF score is below 40%?
Segment your results before drawing conclusions. Average scores hide strong pockets. If a specific segment — by use case, company size, or channel — scores above 40%, reposition the product for that segment. If no segment clears the bar, the core value proposition needs rethinking, not just the messaging.
How do I run a PMF measurement sprint?
Run the one-question PMF survey to your active users, plot a retention cohort chart by signup month, calculate NPS broken out by segment, and track weekly active usage. Do all four in one sprint. One metric alone will give you a partial picture. The four together tell you what to do next.
Identify your Product-Market Fit.
Set your goal. Answer a few questions. CorZen turns it into a week-by-week plan you can run without guessing what comes next.
Plan my PMF sprint